Postdoctoral Fellow
T.H. Chan School of Public Health, Harvard University
About Me
I am an environmental geographer interested in how global environmental change is affecting human well-being. Before academia, I lived all over the world - from Mali to Alaska to the Philippines - working at the intersection of policy and research. Now, I work with large datasets at global scales using data science methods, but with my research questions and hypotheses deeply informed by my experiences in the field and in the policy sector.
In my research, I work with “big micro-data”: surveys conducted at individual and household levels, combined and harmonized to give a global, high-resolution picture of human well-being. Combining these data with information on prevailing ecological, agricultural, and climatological conditions, I use machine learning methods to better understand how the environment affects human well-being. I’m particularly interested in understanding which populations are most vulnerable to environmental change and which policy interventions could lead to the greatest improvements in well-being, as well as using scenarios to attribute well-being to historical change and forecast what the future might look like.
- Data Science
- Climate Change
- Food Security
- Global Health
- Environmental Conservation
Select Publications
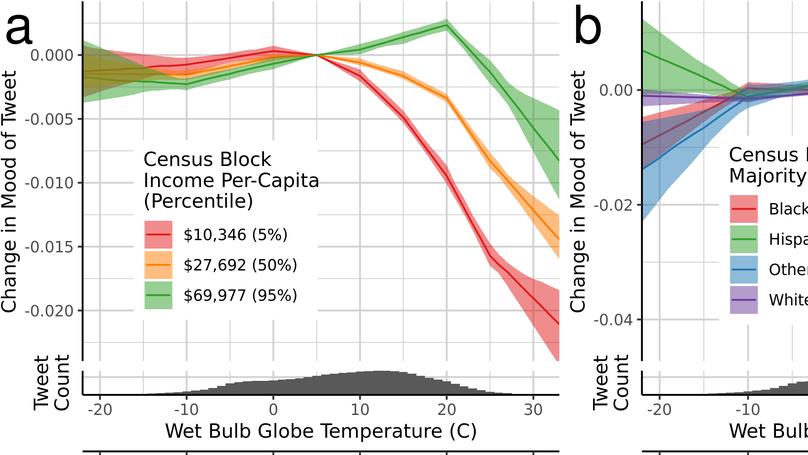
Higher temperatures associated with climate change are expected to have major impacts on human mental health, and previous work has found strong associations between heat and mental well-being. However, these studies typically use data reported at the city or county level, and, to date, have found no difference in vulnerability based on income or race. We therefore use expressed mood in a quarter of a billion geolocated tweets as a proxy for mental health status available at fine spatial and temporal scales, and find stark differences in the effects of heat depending on neighborhood characteristics. Here we show that increased temperatures worsen expressed mood in all areas, but that this effect is much stronger in poor and Black neighborhoods. We also find that the effect of heat on expressed mood is greatest in the early morning, supporting the hypothesis that heat affects mental health through a sleep quality pathway. This paper presents the first evidence of neighborhood heterogeneity in the vulnerability of mental health to heat.
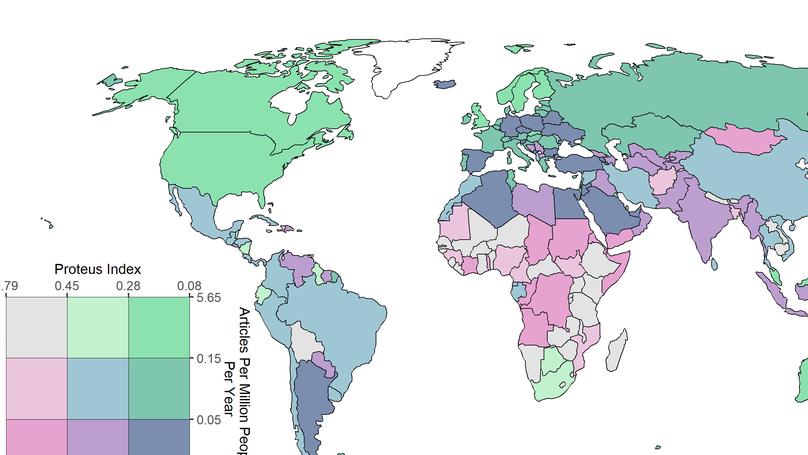
We used text mining to analyze 16,152 abstracts related to food security. We report statistical bias in the spatial distribution of the food security literature. Initially the literature focused on food supplies and global policy. Results show that the FAO pillars are a valid framework for the food security literature.
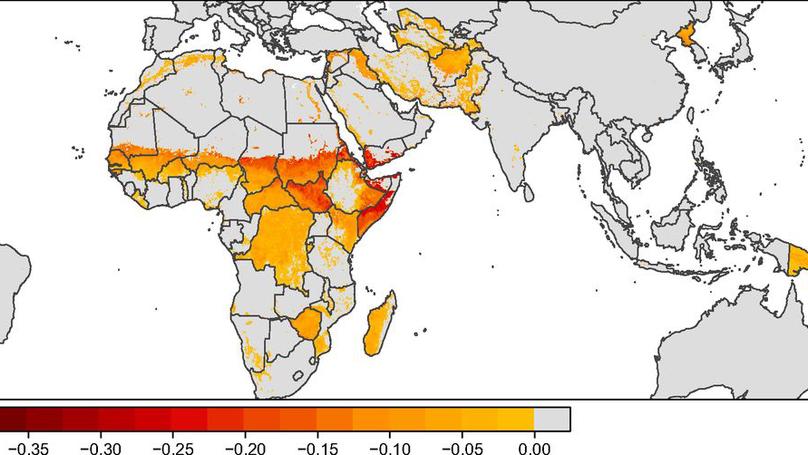
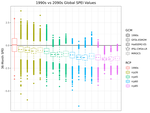
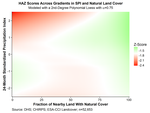
We use geolocated child nutrition data from 53 developing countries to show that minor to severe droughts as well as severe periods of extreme rainfall are related to child stunting. We then explore how various geographic factors mitigate or amplify the effect of drought on child heights. Finally, we combine global data on these factors to map where child stunting is currently vulnerable to drought, finding that arid low-income countries with poor governance and political instability are where drought could have the largest effect on child stunting.
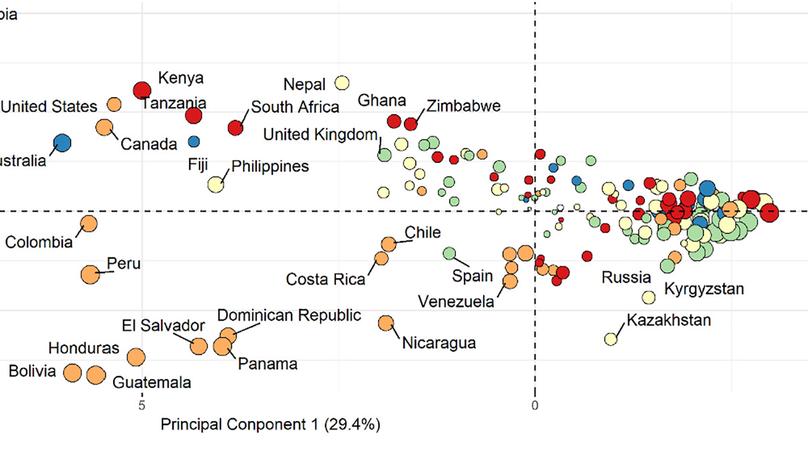
Due to the importance of public support in fostering positive outcomes for biodiversity, Aichi Biodiversity Target 1 aims to increase public awareness of the value of biodiversity and actions that help to conserve it. However, indicators for this critical target have historically relied on public-opinion surveys that are time-consuming, geographically restricted, and expensive. Here, we present an alternative approach based on tracking the use of biodiversity-related keywords in 31 different languages in online newspapers, social media, and internet searches to monitor Aichi Target 1 in real-time, at a global scale, and at relatively low cost. By implementing the indicator, we show global patterns associated with spatio-temporal variability in public engagement with biodiversity topics, such as a clear drop in conversations around weekends and biodiversity-related topic congruence across culturally similar countries. Highly divergent scores across platforms for each country highlight the importance of sourcing information from multiple data streams. The data behind this global indicator is visualized and publicly available at BiodiversityEngagementIndicator.com and can be used by countries party to the Convention on Biological Diversity (CBD) to report on their progress towards meeting Aichi Target 1 to the Secretariat. Continued and expanded monitoring using this indicator will provide further insights for better targeting of public awareness campaigns.

